In this blog post I directly compare some of SSH's results with my results. I put special emphasis on the plots showing the predictions for solar cycle 23 and for the current cycle 24. I also comment on the robustness check that SSH use to test the model; a check that in my opinion fails.
I do not expect to get exactly the same results and plots as SSH do. We use different resolution for the start and end of the solar cycles, as explained in appendix A in [3]. SSH calculate with yearly absolute temperatures, and I calculate with monthly temperature anomalies. For some of the temperature series I have tried the same approach as SSH use, getting approximately the same results as with my approach.
SSH and I have analyzed the same 13 local temperature series and the HadCRUT3 NH temperature series. I addition, SSH have analyzed two temperature series, one for Europe and one for Norway, and I have analyzed the global HadCRUT3 temperature series.
SSH show many plots in [2], and I show corresponding plots in this blog post. The observed mean temperatures up to now are displayed in the lower panels in Figure 1 to 15. They match well with the corresponding mean temperatures in the SSH plots in [2], except for Nuuk Greenland. This is commented after Figure 13. With the exception of Nuuk, we probably use the same sources for the temperature series. Figure 1 to 15 corresponds to Fig. 4 to Fig. 19 in [2].
Common explanations for Figure 1 to 15:
- Lower panel left plot
shows the observed mean temperatures (blue circles) up to now, including the mean temperature observed so far in the current solar cycle 24 (blue star), and the predicted mean temperature for solar cycle 24 (red star). The blue trend line is the best fit to the blue circles. The temperatures are plotted as a function of calendar year. - Lower panel right plot
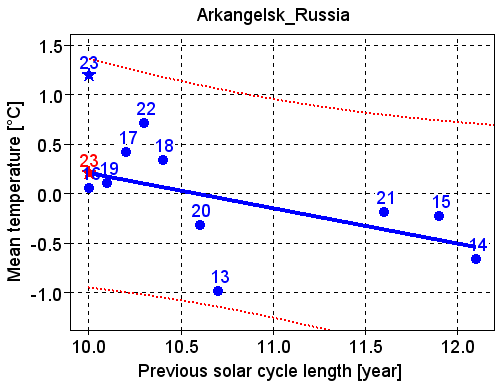
shows the same temperatures as in the left plot, but now they are plotted as a function of the length of the previous solar cycle length. The blue trend line is the best fit to the blue circles. The dashed red lines show the 95% confidence interval (uncertainty range) around the prediction for solar cycle 24. - Upper panel
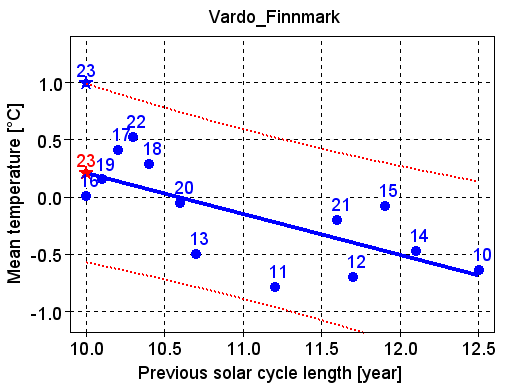
shows how the mean temperature in solar cycle 23 is predicted. The blue trend line is the best fit to the observed mean temperatures in the solar cycles up to and including number 22 (blue circles). The observed mean temperature in solar cycle 23 (blue star) is not used in the best fit calculation for the blue trend line. The predicted temperature for solar cycle 23 (red star) is at the trend line at the horizontal value 10 years, because the length of solar cycle 22 was 10 years. The dashed red lines show the 95% confidence interval around the prediction for solar cycle 23.
My conclusion is in the last part of the blog post, after Figure 15.
 |
| Figure 1. Tromsø Norway 1868 - Apr 2012. Corresponds to Fig. 4 in [2]. |
 |
| Figure 2. Dombås Norway 1865 - Apr 2012. Corresponds to Fig. 5 in [2]. |
 |
| Figure 3. Oksøy Norway 1870 - Apr 2012. Corresponds to Fig. 8 in [2]. |
 |
| Figure 4. Utsira Norway 1868 - Apr 2012. Corresponds to Fig. 9 in [2]. |
 |
| Figure 5. Bodø Norway 1868 - Apr 2012. Corresponds to Fig. 10 in [2]. |
 |
| Figure 6. Karasjok Norway 1876 - Apr 2012. Corresponds to Fig. 11 in [2]. |
 |
| Figure 7. Vardø Norway 1850 - May 2012. Corresponds to Fig. 12 in [2]. |
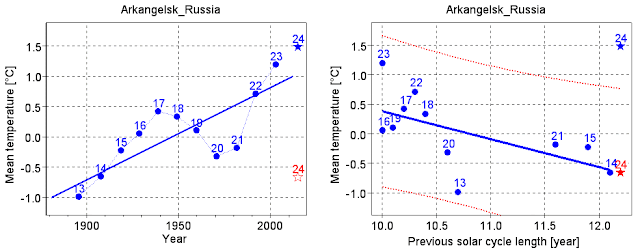 |
| Figure 8. Archangel Russia 1881 - Apr 2012. Corresponds to Fig. 13 in [2]. |
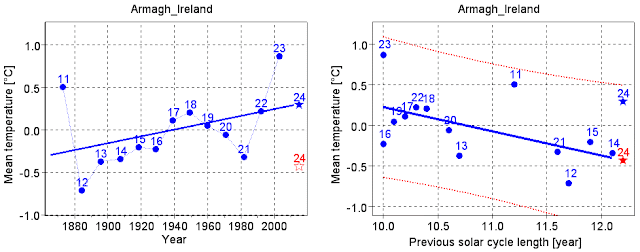 |
| Figure 9. Armagh Ireland 1865 - Nov 2011. Corresponds to Fig. 14 in [2]. |
 |
| Figure 10. Torshavn Faroe Islands 1890 - Apr 2012. Corresponds to Fig. 15 in [2]. |
 |
| Figure 11. Akureyri Iceland 1882 - Mar 2012. Corresponds to Fig. 16 in [2]. |
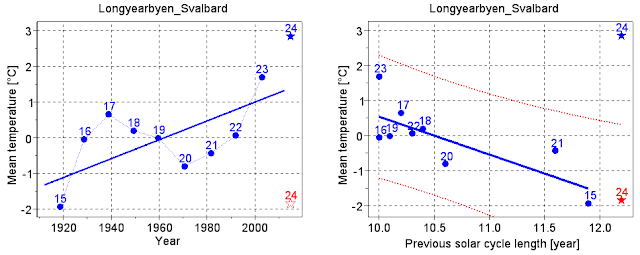 |
| Figure 12. Longyearbyen Svalbard 1912 - Apr 2012. Corresponds to Fig. 17 in [2]. |
 |
| Figure 13. Nuuk Greenland 1890 - Apr 2012. Corresponds to Fig. 18 in [2]. |
The temperature series for Nuuk is fetched from rimfrost. It started in january 1890. Solar cycle 14 is therefore the first one in Figure 13. SSH use temperatures starting in 1881, which give them one more solar cycle. But they display two more cycles in their Fig. 18 in [2] than I do in Figure 13. SSH may have downloaded the Nuuk temperature series from NASA GISS. The GISS series starts in January 1881. It lacks many monthly temperatures, and it lacks the yearly temperature in 1899. I do not know if SSH have used that series, and if they have, I do not know how they have treated the missing information.
There are considerable differences between Figure 13 and Fig. 18 in [2], probably due to different sources for the temperature series .
 |
| Figure 14. HadCRUT3 NH 1850 - Mar 2012. Corresponds to Fig. 19 in [2]. |
 |
| Figure 15. HadCRUT3 1850 - Aug 2012. SSH have no plots for this series. |
Conclusion
The dotted red lines showing the 95% confidence intervals in Figure 1 to 15 match rather well with the corresponding confidence intervals in SSH's figures. In Table 1 in [2] SSH present statistics for the predictions for solar cycle 24, including the numerical values of the 95% confidence intervals. The average of the spans of their confidence intervals is almost exactly the same as the average of the spans that I calculate.The agreement between SSH's calculations and mine is good when we predict the mean temperature for solar cycle 24. I therefore expected a similar good agreement for cycle 23. But there seems to be no agreement between SSH's statistics and mine when we predict the mean temperature for solar cycle 23. In chapter 3.5 in [2] SSH write: "To check the robustness of the forecast with the PSCL-model we have for all 16 datasets removed the last entry, which is the SC23 temperature, and used the remaining observations for generating a forecast of t(SC23). The result is that the forecast for 11 of the 15 series with 95% confidence intervals are within this interval." As we can see in the upper panels in my Figure 1 to 15, all 15 observed mean temperatures in solar cycle 23 are higher than their predictions. 11 of them are higher than the upper limit of the 95% confidence interval. In appendix C in [3] I present more statistics. SSH do no present any plots or statistics that support their claim about their predictions for solar cycle 23. Therefore I am not able to comment more on the difference between their results and mine.
In my opinion the robustness test with solar cycle 23 fails, also when we apply SSH's results. Statistically there is only 2.5% probability that an observed mean temperature shall be higher than the upper limit of the 95% confidence interval around its prediction. I.e. it shall happen only in 1 out of 40 cases. With SSH's results it happened in 4 out of 15 cases. With mine results it happened in 11 out of 15 cases. SSH should also have noticed and informed the reader that all observed mean temperatures in solar cycle 23 are higher than their predictions.
Let us assume that the 15 temperature series that SSH use in their robustness test are independent of each other. Then it is less than 0.1% probability that 4 or more observed mean temperatures should be higher than the upper limit of their 95% confidence intervals. But the temperature series are not independent of each other, both because of geographical closeness and because they are measured in the same solar cycle. This is a major weakness in the test itself. It is better to check the predictions for several solar cycles based on a global temperature series, as has been done in [3]. They show that the model has failed since the mid-1970s.
References
1.
Solar Activity and Svalbard Temperatures
Jan-Erik Solheim, Kjell Stordahl and Ole Humlum
2.
The long sunspot cycle 23 predicts a significant temperature decrease in cycle 24
Jan-Erik Solheim, Kjell Stordahl and Ole Humlum
3.
Solar Cycle Model fails after mid-1970s
Hans Petter Jacobsen




Ingen kommentarer:
Legg inn en kommentar